
Monitoring Apache Spark on Kubernetes with Prometheus and Grafana
08 Jun 2020 by dzlabThere are several ways to monitor Apache Spark applications (see):
- Using Spark web UI or the REST API,
- Exposing metrics collected by Spark with Dropwizard Metrics library through JMX or HTTP,
- Using more ad-hoc approach with JVM or OS profiling tools (e.g. jstack).
In case your Spark cluster runs on Kubernetes, you probably have a Prometheus/Grafana used to monitor resources in your cluster. It would make sense to also add Spark to the list of monitored resources rather than using a different tool specifically for Spark.
One strategy would be to export Spark metrics through a JMX port and configure Prometheus to poll/scrap metrics from this endpoit. The final monitoring architecture would look like the following picture.
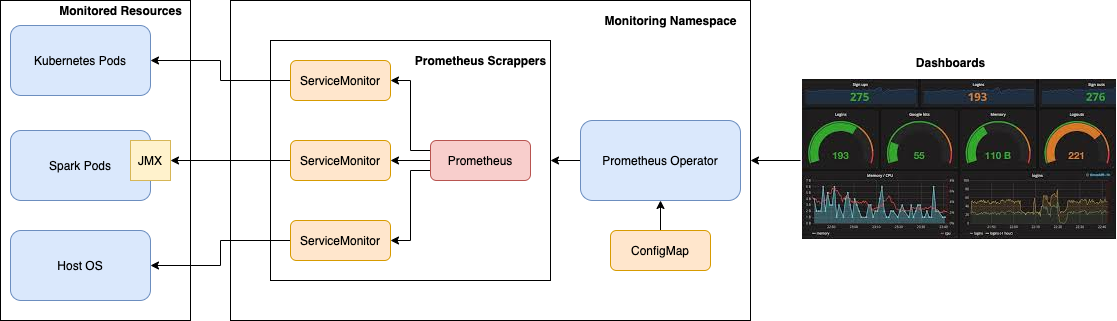
The metrics travel from left to right, start at the Pods running resources like Spark, get exposed (e.g. through JMX), then Prometheus scrappers poll those metrics and store them in Prometheus database. Finally, Grafana dashboards query those metrics to viusualize them.
The remain of this article discribes how to implement such an articture using Prometheus operator and Prometheus JMX exporter.
Exposing Spark metrics
First we need to make sure that Spark is collecting metrics by enabling this in the $SPARK_HOME/conf/metrics.properties file. This file has tons of metrics, we are interested in exposing a JMX sink only, which we can achieve by adding/uncommenting the following line:
*.sink.jmx.class=org.apache.spark.metrics.sink.JmxSink
JMX Exporter
Now, Spark will collect metrics but it is not over yet, we need to expose them through a network port of choice (e.g. 9091). To do this, we need to make sure when we start Spark with Prometheus JMX Exporter agent. This agent accepts a configuration file to control what metrics to be exposed, for instance to export Spark BlockManager and DAGScheduler metrics the content of $SPARK_HOME/conf/prometheus-config.yml would look like:
---
lowercaseOutputName: true
attrNameSnakeCase: true
rules:
- pattern: metrics<name=(\S+)\.driver\.(BlockManager|DAGScheduler)\.(\S+)><>Value
  name: spark_$2_$3
  labels:
    app_id: "$1"
Now we are ready to start Spark, collect metrics and expose them through a JMX port
./spark-submit \
  ... \
  --conf spark.driver.extraJavaOptions=-javaagent:$SPARK_HOME/jars/jmx_prometheus_javaagent.jar=9091:$SPARK_HOME/conf/prometheus-config.yml \
  ...
Expose JMX endpoint
Note that you can visualize the metrics, e.g. by using kubernetes proxy
$ kubectl proxy
Then visiting a url of the form http://localhost:8001/api/v1/proxy/namespaces/<SPARK_NAMESPACE>/services/<SPARK_SERVICE_NAME>:9091/
Scrapping metrics with Prometheus
Installing and setting up Prometheus on Kubernetes is super easy with Prometheus Operator which is a Helm chart that makes life easy when it comes to configuring the monitoring of k8s deployment and services. It can be installed with helm (v3) as follows:
$ helm install prometheus stable/prometheus-operator --namespace monitoring
Prometheus Operator
This Prometheus Operator will help us to install and configure:
- A full Kubernetes-Prometheus-Grafana stack: Prometheus servers, Alertmanager and Grafana
- Metrics exporters: Host node_exporter, kube-state-metrics
In addition to those out of the box monitoring components, we can use this Operator to define how metrics exposed by Spark will be pulled into Prometheus using Custom Resource Definitions (CRDs) and ConfigMaps. More specifically, to monitor Spark we need to define the following objects:
Prometheusto define a Prometheus deployment.ServiceMonitor, define how set of services should be monitored.PrometheusRule, define a Prometheus rule file.Alertmanager, define an Alertmanager deployment.
The following diagram depicts how those component interact with each other.

Back to configuring Prometheus scrapping for Spark, we first need to create a Prometheus object that can auto discover ServiceMonitor objects with a matching label of app=spark:
apiVersion: monitoring.coreos.com/v1
kind: Prometheus
metadata:
  name: prometheus
spec:
  serviceMonitorSelector:
    matchLabels:
      app: spark
  enableAdminAPI: false
We can apply and check this object was created successfully with the following commands:
$ kubectl apply -f prometheus.yaml -n monit
prometheus.monitoring.coreos.com/prometheus created

$ kubectl get prometheus -n monitoring
NAME                                    VERSION   REPLICAS   AGE
prometheus                                                   21s

$ kubectl describe prometheus prometheus -n monit
Name:         prometheus
Namespace:    monit
Labels:       <none>
Annotations:  API Version:  monitoring.coreos.com/v1
Kind:         Prometheus
Metadata:
  Creation Timestamp:  2020-06-08T23:19:48Z
  Generation:          1
  Resource Version:    16937
  Self Link:           /apis/monitoring.coreos.com/v1/namespaces/monit/prometheuses/prometheus
  UID:                 83b83b22-073d-4d40-bdd4-75ef59fefd5d
Spec:
  Enable Admin API:      false
  Service Account Name:  prometheus
  Service Monitor Selector:
    Match Labels:
      App:  spark
Then we create a ServiceMonitor object with following content (note the app: spark label):
apiVersion: monitoring.coreos.com/v1
kind: ServiceMonitor
metadata:
  name: servicemonitor-spark
  labels:
    app: spark
spec:
  selector:
    matchLabels:
      app: spark
  endpoints:
  - port: metrics
Similarly, apply and check this description as follows
$ kubectl apply -f servicemonitor-spark.yaml -n monit
servicemonitor.monitoring.coreos.com/servicemonitor-spark created

$ kubectl get servicemonitor -n monit
NAME                                             AGE
servicemonitor-spark                             40s

$ kubectl describe servicemonitor servicemonitor-spark -n monit
Name:         servicemonitor-spark
Namespace:    monitoring
Labels:       app=spark
Annotations:  API Version:  monitoring.coreos.com/v1
Kind:         ServiceMonitor
Metadata:
  Creation Timestamp:  2020-06-08T23:24:50Z
  Generation:          1
  Resource Version:    17516
  Self Link:           /apis/monitoring.coreos.com/v1/namespaces/monit/servicemonitors/servicemonitor-spark
  UID:                 917c51ac-bdb0-4dca-88d9-7098a5d483c5
Spec:
  Endpoints:
    Interval:  5s
    Path:      /metrics
    Port:      metrics
  Namespace Selector:
    Match Names:
      spark-app-ns
  Selector:
    Match Labels:
      App:  spark
Events:              <none>
Finally, we need to create a Service object for our application deployment (note the app: spark label):
apiVersion: v1
kind: Service
metadata:
  name: spark-svc
  labels:
    app: spark
spec:
  ports:
    - name: metrics
      port: 9091
      targetPort: 9091
      protocol: TCP
  selector:
    app: spark
After that, the newly scrapped endpoint will appear on Prometheus Web UI at the /targets endpoint.