
Capture container logs in Kubernetes with Splunk Connect
04 Jan 2022 by dzlab

Splunk allows the collection and analyzes of high volumes of machine-generated data (e.g. application logs). Once the data becomes indexes in Splunk, one can build reporting dashboard and alerts based of specific search. For instance, one can build a dashboard for application crashes, or failures to handle incoming request and track this over time. Splunk provides many integrations that makes it very easy to collect logs from a varied of sources. In this article, we will examine how to collect logs from cloud native applications running on Kubernetes.
Setting up Splunk
Note: if you already have a Splunk instance or an account on Splunk Cloud then you can skip this step.
Splunk Operator
We can easily setup Splunk on Kubernetes using the official operator - link.
First, create a Kubernetes namespace to host the pods of the Splunk operator as well as Splunk itself.
$ kubectl create namespace monit
Second, install Splunk official operator in the newly created namespace as follows
$ kubectl apply -f https://github.com/splunk/splunk-operator/releases/download/1.0.2/splunk-operator-install.yaml -n monit
customresourcedefinition.apiextensions.k8s.io/clustermasters.enterprise.splunk.com created
customresourcedefinition.apiextensions.k8s.io/indexerclusters.enterprise.splunk.com created
customresourcedefinition.apiextensions.k8s.io/licensemasters.enterprise.splunk.com created
customresourcedefinition.apiextensions.k8s.io/searchheadclusters.enterprise.splunk.com created
customresourcedefinition.apiextensions.k8s.io/standalones.enterprise.splunk.com created
serviceaccount/splunk-operator created
role.rbac.authorization.k8s.io/splunk:operator:namespace-manager created
rolebinding.rbac.authorization.k8s.io/splunk:operator:namespace-manager created
deployment.apps/splunk-operator created
After few seconds, the operator will become ready to use, you can check the Pod status with
$ kubectl get pods -n monit
NAME                              READY   STATUS    RESTARTS   AGE
splunk-operator-f7c8d94f9-tsp9z   1/1     Running   0          10s
Splunk Standalone
Now, we can deploy Splunk using this operator
$ cat <<EOF | kubectl apply -n monit -f -
apiVersion: enterprise.splunk.com/v2
kind: Standalone
metadata:
  name: s1
  finalizers:
  - enterprise.splunk.com/delete-pvc
EOF
standalone.enterprise.splunk.com/s1 created
Note: In this case we are installing a standlone deployment as we will use Splunk for testing, in reality a more advance configuration is needed to insure High Availability.
After few moments, Splunk Pods will become available and ready to be used. We can check their status as follows:
$ kubectl get pods -n monit
NAME                                  READY   STATUS    RESTARTS   AGE
splunk-default-monitoring-console-0   1/1     Running   0          3m19s
splunk-operator-f7c8d94f9-tsp9z       1/1     Running   0          6m38s
splunk-s1-standalone-0                1/1     Running   0          5m56s
Splunk credentials
To get the credentials to access Splunk Web UI with kubectl we can print the secret created as part of the deployment of Splunk as follows:
$ kubectl get secret splunk-monit-secret -o yaml -n monit
apiVersion: v1
data:
  hec_token: N0NEMDQwRDgtMDc0NC1EOEQ3LTU1NDgtOTg4NzY1QTZDODA2
  idxc_secret: U3BHWUhsS1lIajdXRFpsOFkxcVh1UDQy
  pass4SymmKey: TUtnZjVOTXZhUEs4WnFTQzc0V0V2S2hu
  password: QVJEcEZ6OWx1OHJEbnl2MjJlU0FwTDhh
  shc_secret: T1Yxd3p4bGlNZTJkcEZkNzhsOVRXbm9T
kind: Secret
metadata:
  creationTimestamp: "2021-08-25T17:32:03Z"
  managedFields:
  - apiVersion: v1
    fieldsType: FieldsV1
    fieldsV1:
      f:data:
        .: {}
        f:hec_token: {}
        f:idxc_secret: {}
        f:pass4SymmKey: {}
        f:password: {}
        f:shc_secret: {}
      f:metadata:
        f:ownerReferences:
          .: {}
          k:{"uid":"3ba7943f-b283-452d-9917-02ebb7f7d114"}:
            .: {}
            f:apiVersion: {}
            f:controller: {}
            f:kind: {}
            f:name: {}
            f:uid: {}
      f:type: {}
    manager: splunk-operator
    operation: Update
    time: "2021-08-25T17:32:03Z"
  name: splunk-default-secret
  namespace: default
  ownerReferences:
  - apiVersion: enterprise.splunk.com/v2
    controller: false
    kind: Standalone
    name: s1
    uid: 3ba7943f-b283-452d-9917-02ebb7f7d114
  resourceVersion: "851"
  uid: 15ed8cc4-6af0-438d-8568-0b096454c2f1
type: Opaque
Note: the secret name splunk-monit-secret is a composed name of the
- -secret. If splunk is deployed in the default namespace, the secret name will be splunk-default-secret
To get the values of all the secrets stored here we can do
$ kubectl get secret splunk-monit-secret -n monit -o go-template=' {{range $k,$v := .data}}{{printf "%s: " $k}}{{if not $v}}{{$v}}{{else}}{{$v | base64decode}}{{end}}{{"\n"}}{{end}}'
hec_token: 7CD040D8-0744-D8D7-5548-988765A6C806
idxc_secret: SpGYHlKYHj7WDZl8Y1qXuP42
pass4SymmKey: MKgf5NMvaPK8ZqSC74WEvKhn
password: ARDpFz9lu8rDnyv22eSApL8a
shc_secret: OV1wzxliMe2dpFd78l9TWnoS
To get one specific secret, for instance the Splunk Web UI password of the admin user we can do
$ kubectl get secret splunk-monit-secret -n monit -o go-template='{{ index .data "password" }}' | base64 -d
ARDpFz9lu8rDnyv22eSApL8a
Then we can access the Web UI by setting up port-forwarding to Splunk as follows
$ kubectl port-forward splunk-s1-standalone-0 8000 -n monit
Forwarding from 127.0.0.1:8000 -> 8000
Forwarding from [::1]:8000 -> 8000
Splunk Connect
To be able to send logs to our Splunk deployment we need to get credentials. In our case, we specifically need HEC (HTTP Event Collector) token.
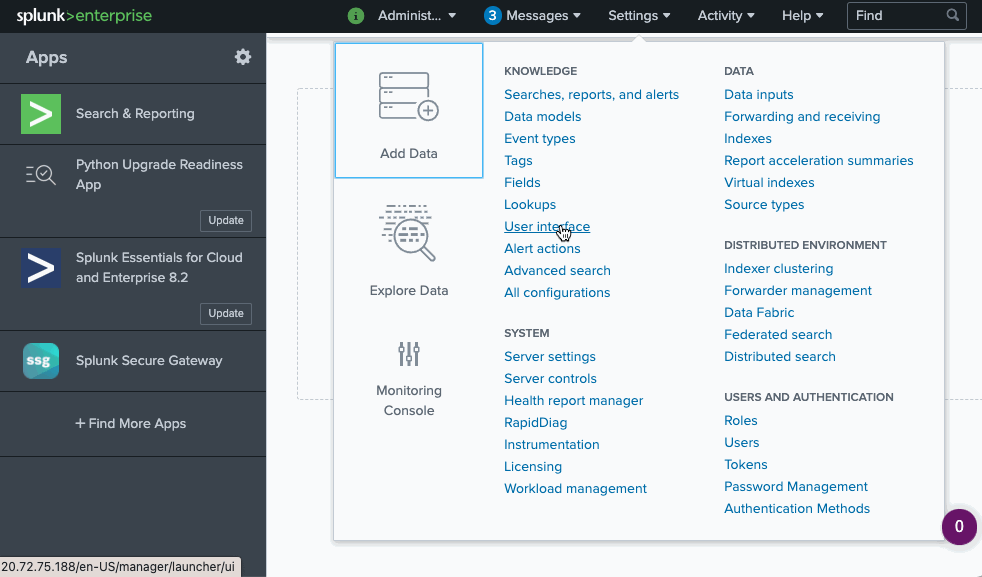
We can get this HEC token using kubectl or using Splunk admin page as follows:
To get the HEC token using kubectl instead we can do
$ kubectl get secret splunk-monit-secret -n monit -o go-template='{{ index .data "hec_token" }}' | base64 -d
ARDpFz9lu8rDnyv22eSApL8a
Configuration file
We need to pupulate a custom version of values.yaml with information specific to our Splunk instance like hostname and HEC token.
We need to create some environment variables to use when filling in the values.yaml file.
1. get Get splunk server address, use DNS name <service>.<namespace> or just <service>
$ hostname="splunk-s1-standalone-service"
2. get the Splunk HEC token into a variable
$ token=`kubectl get secret splunk-monit-secret -n monit -o go-template='{{ index .data "hec_token" }}' | base64 -d`
3. get the Splunk admin password into a variable
$ password=`kubectl get secret splunk-monit-secret -n monit -o go-template='{{ index .data "password" }}' | base64 -d`
4. choose the index name to be used by Splunk to host the logs
$ index="main"
5. pick a filename where the values will created.
$ file=$(mktemp /tmp/splunk-connect-values.XXXXXX)
6. Create the values file and configure each section.
For instance, the bare minimum file would look like this where we disable sending to Splunk the kubernetes objects and metrics but only allow logging messages to be sent.
$ cat >"${file}" << EOF
global:
  splunk:
    hec:
      host: ${hostname}
      port: 8088
      token: ${token}
      protocol: https
      indexName: ${index}
      insecureSSL: true

splunk-kubernetes-logging:
  enabled: true
splunk-kubernetes-objects:
  enabled: false
splunk-kubernetes-metrics:
  enabled: false
EOF
Note: by default the expected log format is JSON
But your containers may output text logs that can be on multi-line like the example below
2022-01-05T16:52:17.283-0800 level=INFO thread=thrad1 logger=dzlab.logger
This is the log message
In such case, you can customize the logs section in the values file as follows:
$ cat >"${file}" << EOF
global:
  splunk:
    hec:
      host: ${hostname}
      port: 8088
      token: ${token}
      protocol: https
      indexName: ${index}
      insecureSSL: true

splunk-kubernetes-logging:
  enabled: true
  containers:
    logFormat: '%Y-%m-%dT%H:%M:%S.%N%:z'
    logFormatType: cri
  logs:
    applogs:
      from:
        pod: '*'
      multiline:
        firstline: /^\d{4}-\d{2}-\d{2}T\d{2}:\d{2}:\d{2}\.\d{3}[-+]\d{4}/
        separator: ""

splunk-kubernetes-objects:
  enabled: false
splunk-kubernetes-metrics:
  enabled: false
EOF
Note: the url to Splunk endpoint is given through the fields
host,portandprotocol. But you can also provide a full url (e.g. if the endpoint is behind a proxy) usingfull_urlfield. For details, see the following Pull Request.
Installation with Helm
To be able ot install Splunk Connect with Helm, we to indicate to Helm where to find the charts. For this, add the Splunk Connect github repository to the list of local Help repositories
$ helm repo add splunk https://splunk.github.io/splunk-connect-for-kubernetes/
"splunk" has been added to your repositories
Now we can install Splunk Connect on the monitoring namespace using the custom values file we created in the previous section.
$ helm install splunkconnect -n monit -f "${file}" splunk/splunk-connect-for-kubernetes
NAME: splunkconnect
LAST DEPLOYED: Wed Aug 25 11:26:37 2021
NAMESPACE: default
STATUS: deployed
REVISION: 1
TEST SUITE: None
NOTES:
███████╗██████╗ ██╗     ██╗   ██╗███╗   ██╗██╗  ██╗██╗
██╔════╝██╔══██╗██║     ██║   ██║████╗  ██║██║ ██╔╝╚██╗
███████╗██████╔╝██║     ██║   ██║██╔██╗ ██║█████╔╝  ╚██╗
╚════██║██╔═══╝ ██║     ██║   ██║██║╚██╗██║██╔═██╗  ██╔╝
███████║██║     ███████╗╚██████╔╝██║ ╚████║██║  ██╗██╔╝
╚══════╝╚═╝     ╚══════╝ ╚═════╝ ╚═╝  ╚═══╝╚═╝  ╚═╝╚═╝

Listen to your data.

Splunk Connect for Kubernetes is spinning up in your cluster.
After a few minutes, you should see data being indexed in your Splunk.

If you get stuck, we're here to help.
Look for answers here: http://docs.splunk.com

Warning: Disabling TLS will send the data unencrypted and will be vulnerable to MiTM attacks
After successfully deploying Splunk Connect an index called main will be created, we can check this in the Splunk UI (at http://localhost:8000 with login admin:${password})

We can also check logs from our Pods are forwarded properly to splunk
