Spark 3.0 Monitoring with Prometheus in Kubernetes
03 Jul 2020 by dzlab
Apache Spark 3.0 brings native support for monitoring with Prometheus in Kubernetes (see Part 1). This enable a lot of interesting monitoring scenarios:
- Monitoring batch job memory behavior for risks of OOM
- Monitoring dynamic allocation behavior for unexpected slowness
- Monitoring streaming job behavior for latency issues
The rest of this article illustres how to use this monitoring support in Apache Spark 3.0.
Minikube (with Docker’s hyperkit) is used to run a Kubernetes cluster.
Minikube setup
You can use an existent Spark Docker image (e.g. bitnami/spark:latest), or build one from source using docker-image-tool.sh (you will need minikube to be installed):
$ minikube start --driver=hyperkit --memory 8192 --cpus 4
😄  minikube v1.9.2 on Darwin 10.15.5
✨  Using the hyperkit driver based on user configuration
👍  Starting control plane node m01 in cluster minikube
🔥  Creating hyperkit VM (CPUs=4, Memory=8192MB, Disk=20000MB) ...
🐳  Preparing Kubernetes v1.18.0 on Docker 19.03.8 ...
🌟  Enabling addons: default-storageclass, storage-provisioner
🏄  Done! kubectl is now configured to use "minikube"
$ eval $(minikube docker-env)
$ $SPARK_HOME/bin/docker-image-tool.sh -m -t 3.0.0 build
$ docker images
REPOSITORY                                TAG                 IMAGE ID            CREATED              SIZE
spark                                     3.0.0               2762cab6a347        About a minute ago   486MB
To see the status of the Kubernetes resrouces (including those created for the submitted Spark job), open Kubernetes Dashboard on a new tab of your default browser with:
$ minikube dashboard
🔌  Enabling dashboard ...
🤔  Verifying dashboard health ...
🚀  Launching proxy ...
🤔  Verifying proxy health ...
🎉  Opening http://127.0.0.1:51269/api/v1/namespaces/kubernetes-dashboard/services/http:kubernetes-dashboard:/proxy/ in your default browser...
To submit a Spark job to this Kubernetes cluster, we need to get the Kubernetes API Server URL:
$ kubectl cluster-info
Kubernetes master is running at https://kubernetes.docker.internal:6443
KubeDNS is running at https://kubernetes.docker.internal:6443/api/v1/namespaces/kube-system/services/kube-dns:dns/proxy

To further debug and diagnose cluster problems, use 'kubectl cluster-info dump'.
$ export K8S_MASTER=https://192.168.64.4:8443
Prometheus setup
Install Prometheus using the Prometheus Operator
$ helm install prometheus stable/prometheus-operator
$ kubectl get pods
NAME                                                        READY   STATUS      RESTARTS   AGE
alertmanager-prometheus-prometheus-oper-alertmanager-0      2/2     Running     0          3m19s
prometheus-grafana-57f8ccf8b8-6q9k5                         2/2     Running     0          3m33s
prometheus-kube-state-metrics-6967c9fd67-hdxrx              1/1     Running     0          3m33s
prometheus-prometheus-node-exporter-hbz4f                   1/1     Running     0          3m33s
prometheus-prometheus-oper-operator-c4cc786bd-jvknw         2/2     Running     0          3m33s
prometheus-prometheus-prometheus-oper-prometheus-0          3/3     Running     1          3m9s
$ kubectl get svc
NAME                                                            TYPE        CLUSTER-IP      EXTERNAL-IP   PORT(S)                      AGE
alertmanager-operated                                           ClusterIP   None            <none>        9093/TCP,9094/TCP,9094/UDP   6m39s
kubernetes                                                      ClusterIP   10.96.0.1       <none>        443/TCP                      85m
org-apache-spark-examples-sparkpi-67374573173b4b81-driver-svc   ClusterIP   None            <none>        7078/TCP,7079/TCP,4040/TCP   33s
prometheus-grafana                                              ClusterIP   10.109.7.174    <none>        80/TCP                       6m53s
prometheus-kube-state-metrics                                   ClusterIP   10.104.40.205   <none>        8080/TCP                     6m53s
prometheus-operated                                             ClusterIP   None            <none>        9090/TCP                     6m29s
prometheus-prometheus-node-exporter                             ClusterIP   10.108.163.43   <none>        9100/TCP                     6m53s
prometheus-prometheus-oper-alertmanager                         ClusterIP   10.101.200.74   <none>        9093/TCP                     6m53s
prometheus-prometheus-oper-operator                             ClusterIP   10.103.53.16    <none>        8080/TCP,443/TCP             6m53s
prometheus-prometheus-oper-prometheus                           ClusterIP   10.98.29.191    <none>        9090/TCP                     6m53s
With port forwarding to Prometheus service, expose its UI on http://localhost:9090 with:
$ kubectl port-forward svc/prometheus-prometheus-oper-prometheus 9090:9090
Forwarding from 127.0.0.1:9090 -> 9090
Forwarding from [::1]:9090 -> 9090
Handling connection for 9090
Spark submit
Submit a long running batch job to later monitor its memory behavior using Prometheus.
$ $SPARK_HOME/bin/spark-submit \
    --master k8s://$K8S_MASTER --deploy-mode cluster \
    -c spark.driver.memory=2g  \
    -c spark.executor.instances=3  \
    -c spark.ui.prometheus.enabled=true  \
    -c spark.kubernetes.driver.annotation.prometheus.io/scrape=true  \
    -c spark.kubernetes.driver.annotation.prometheus.io/path=/metrics/executors/prometheus/  \
    -c spark.kubernetes.driver.annotation.prometheus.io/port=4040  \
    -c spark.kubernetes.container.image=spark:3.0.0  \
    --class org.apache.spark.examples.SparkPi local:///opt/spark/examples/jars/spark-examples_2.12-3.0.0.jar 200000

20/07/03 14:40:49 INFO LoggingPodStatusWatcherImpl: State changed, new state:
	 pod name: org-apache-spark-examples-sparkpi-c7985273169ff02c-driver
	 namespace: default
	 labels: spark-app-selector -> spark-d155245fc9ea4201b9b20e0852e04ad0, spark-role -> driver
	 pod uid: 594691c7-e27b-4bb4-a0dd-e1783bb41f02
	 creation time: 2020-07-03T21:40:49Z
	 service account name: default
	 volumes: spark-local-dir-1, spark-conf-volume, default-token-sztzw
	 node name: N/A
	 start time: N/A
	 phase: Pending
	 container status: N/A
Notice the URI of the jar that is being submitted starts with
local://scheme to refer to a location inside the Docker image.
Configurations used to enable monitoring for the submitted the job are:
spark.ui.prometheus.enabledset totrue(see Part 1).spark.kubernetes.driver.annotation.prometheus.io/scrapeset totruean annotation for Prometheus to scrape this endpoint.spark.kubernetes.driver.annotation.prometheus.io/pathset to/metrics/executors/prometheus/an annotation for Prometheus to use this HTTP path to scrape the metrics from.spark.kubernetes.driver.annotation.prometheus.io/portset to4040an annotation for Prometheus to use this as HTTP port for the metrics endpoint to be scrapped.
Spark UI
With port forwarding to Spark Driver kubernetes service, expose the Spark UI (and the metrics endpoint) on http://localhost:4040 with:
$ kubectl port-forward svc/org-apache-spark-examples-sparkpi-67374573173b4b81-driver-svc 4040:4040
Forwarding from 127.0.0.1:4040 -> 4040
Forwarding from [::1]:4040 -> 4040
Handling connection for 4040
Knwon issues
If the spark job fails with a similar error like below, that means the user does not have access to list/get services. We need to assign it a higher role using clusterrolebinding, for testing purpose we will give it Cluster edit role.
First, create a ServiceAccount and assign it this role
$ kubectl logs org-apache-spark-examples-sparkpi-0660097316f032f4-driver
. . .
Caused by: io.fabric8.kubernetes.client.KubernetesClientException: Failure executing: GET at: https://kubernetes.default.svc/api/v1/namespaces/default/pods/org-apache-spark-examples-sparkpi-0660097316f032f4-driver. Message: Forbidden!Configured service account doesn't have access. Service account may have been revoked. pods "org-apache-spark-examples-sparkpi-0660097316f032f4-driver" is forbidden: User "system:serviceaccount:default:default" cannot get resource "pods" in API group "" in the namespace "default".

$ kubectl create serviceaccount spark-sa
$ kubectl create clusterrolebinding spark-role --clusterrole=edit --serviceaccount=default:spark-sa --namespace=default
Second, re-start the spark job with the newly created ServiceAccount as follows:
$ $SPARK_HOME/bin/spark-submit \
    ...
    -c spark.kubernetes.authenticate.driver.serviceAccountName=spark-sa \
    ...
Prometheus Service Discovery
A Kubernetes pod and an associated service should be running the Spark job, and this service is exposing a metrics endpoint. We need to let Prometheus auto-discover this endpoint.
First, we need to make sure the Service is labeled, if not we will add one:
$ kubectl get svc
NAME                                                            TYPE        CLUSTER-IP      EXTERNAL-IP   PORT(S)                      AGE
org-apache-spark-examples-sparkpi-4a06ed73174a2e48-driver-svc   ClusterIP   None            <none>        7078/TCP,7079/TCP,4040/TCP   56s
$ # Check what labels the service has
$ kubectl describe svc org-apache-spark-examples-sparkpi-4a06ed73174a2e48-driver-svc
Name:              org-apache-spark-examples-sparkpi-4a06ed73174a2e48-driver-svc
Namespace:         default
Labels:            <none>
Annotations:       <none>
Selector:          spark-app-selector=spark-a7e1aeab5d6845aeb5bcf6855ebe1f6e,spark-role=driver
Type:              ClusterIP
IP:                None
Port:              driver-rpc-port  7078/TCP
TargetPort:        7078/TCP
Endpoints:         172.17.0.11:7078
Port:              blockmanager  7079/TCP
TargetPort:        7079/TCP
Endpoints:         172.17.0.11:7079
Port:              spark-ui  4040/TCP
TargetPort:        4040/TCP
Endpoints:         172.17.0.11:4040
Session Affinity:  None
Events:            <none>
$ # Add spark-role=driver to the spark service
$ kubectl label svc org-apache-spark-examples-sparkpi-4a06ed73174a2e48-driver-svc spark-role=driver
service/org-apache-spark-examples-sparkpi-4a06ed73174a2e48-driver-svc labeled
Now we need to create a Kubernetes ServiceMonitor object to let Prometheus look for Spark metrics. For more details on setting up Prometheus Service Discovery read on Monitoring Apache Spark on Kubernetes with Prometheus and Grafana.
First, create a file servicemonitor-spark.yaml with the following content
apiVersion: monitoring.coreos.com/v1
kind: ServiceMonitor
metadata:
  labels:
    spark-role: driver
    release:  prometheus
  name: spark-servicemonitor
spec:
  endpoints:
  - interval: 5s
    port: spark-ui
    path: /metrics/executors/prometheus/
  namespaceSelector:
    matchNames:
    - default
  selector:
    matchLabels:
      spark-role: driver
Second, apply this file as follows:
$ kubectl create -f servicemonitor-spark.yaml
servicemonitor.monitoring.coreos.com/spark-servicemonitor created
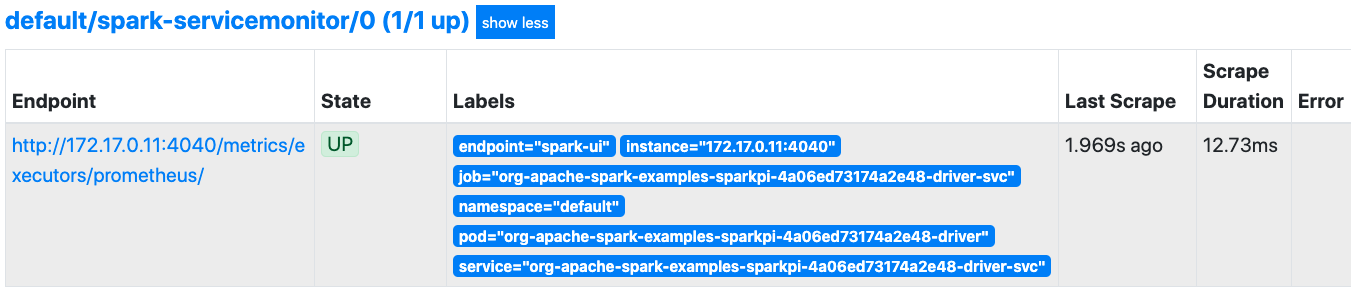
Now visiting the Prometheus Targets page we should be able to see Spark metrics been scrapped
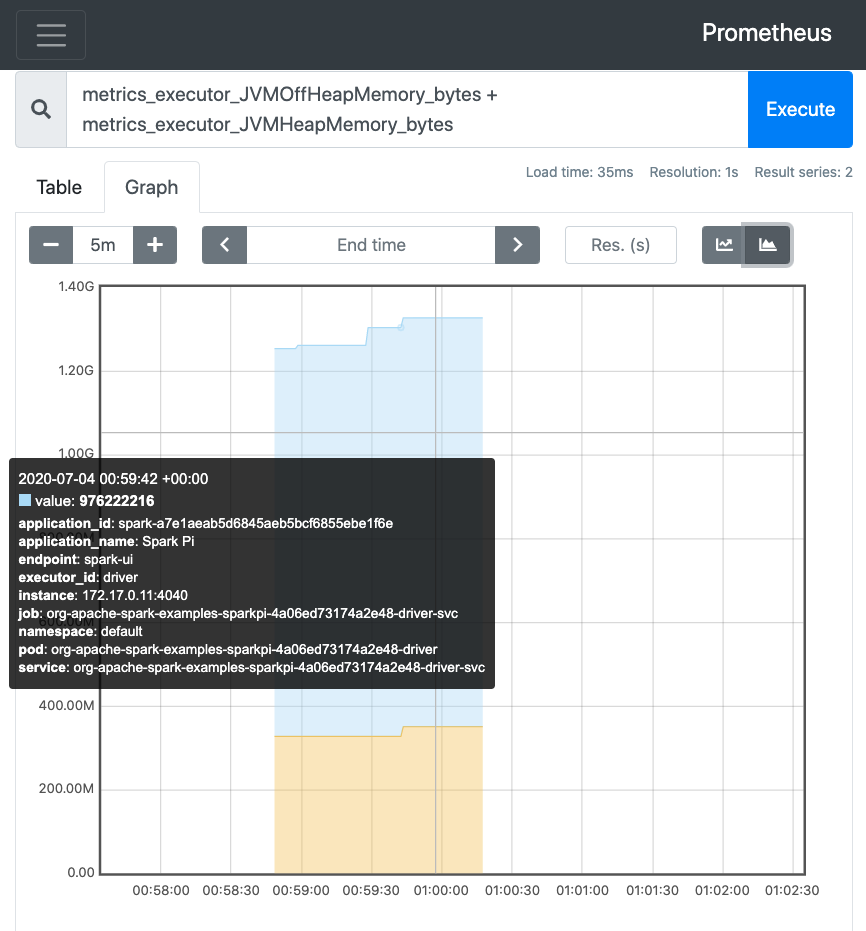
And we can query them in the Prometheus Graphs page, for instance compare the HEAP and OFF-HEAP memory of the job executors: