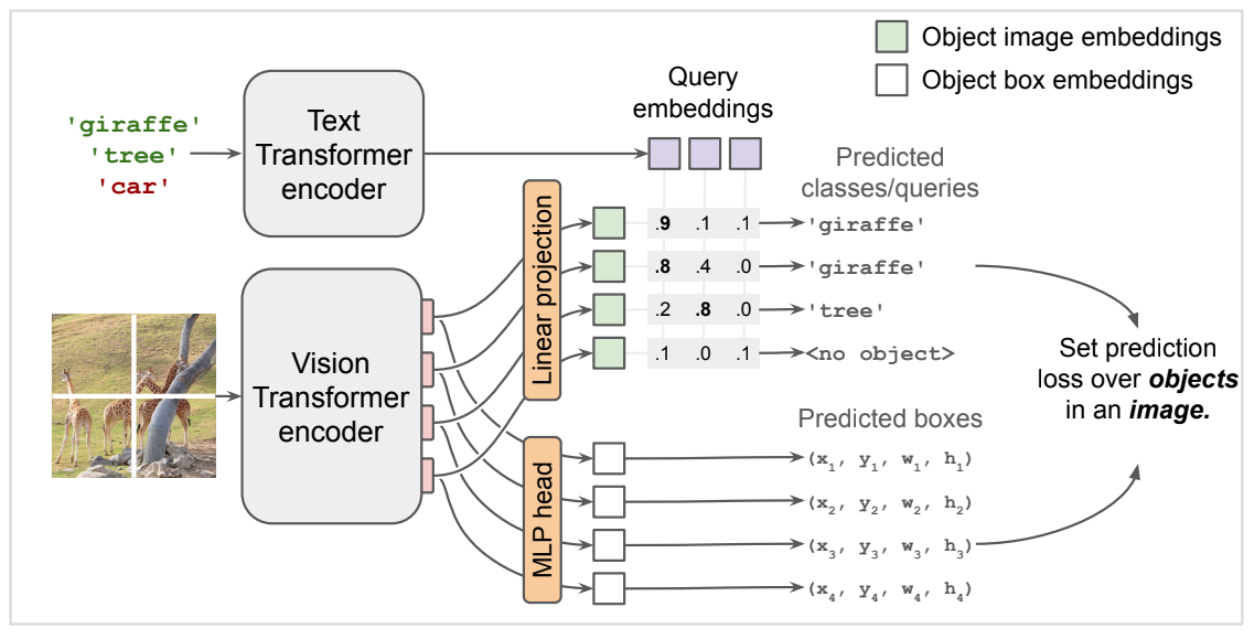
Classifical object detection models can only detect classes seen during the training or fine-tuning phases. A new class of models are able to detect objects based on a text decription. This is known as Zero-shot object detection. OWL ViT is an example of such models.
The OWL ViT model accepts an image and one or more text queries, and tries to detect objects matching the queries. The output predictions of this model are bounding boxes of an object and the probabilities that a certain text embedding applies to a particular object.
As depiected in the figure below, the architecture of OWL ViT relies on two main components:
- CLIP (Contrastive Language-Image Pretraining) for encoding the text query
- Vision Transformer for encoding the input image
During inference, the model is capable of performing zero-shot detection because it relies on CLIP for embedding the text into a space similar to the space of the embeddings from the image.
Another nice feature of OWL ViT as a result of using CLIP, is that in addition to accepting text queries, it can also use an image as a query. This is possible because CLIP projects texts and images into the same embedding space.
 _Object Detection with OWL ViT (source: OWL ViT on GitHub)_
The rest of this article walks through how to use OWL-ViT with Flax. We will clone the repository containing the model code, setup an instance of the model, pre-process the image and the search text, then finally run predictions.
First, let's clone the repository containing OWL ViT implementation and install all needed dependencies.
%%capture
%%bash

git clone https://github.com/google-research/scenic.git --depth 1
pip install scenic/
pip install -r scenic/scenic/projects/owl_vit/requirements.txt
Then, import all needed modules.
import io
import requests
import jax
from PIL import Image
from matplotlib import pyplot as plt
import numpy as np
from scenic.projects.owl_vit.models import TextZeroShotDetectionModule
from scenic.projects.owl_vit.configs import clip_b32
from scenic.projects.owl_vit.notebooks.inference import Model as OWLViTModel
from scipy.special import expit as sigmoid
%matplotlib inline
Initiate the model and load its weights
config = clip_b32.get_config(init_mode='canonical_checkpoint')
module = TextZeroShotDetectionModule(
    body_configs=config.model.body,
    normalize=config.model.normalize,
    box_bias=config.model.box_bias
    )
variables = module.load_variables(config.init_from.checkpoint_path)
Next, we download an image for running predictions
url = 'https://unsplash.com/photos/vMneecAwo34/download?ixid=MnwxMjA3fDB8MXxhbGx8fHx8fHx8fHwxNjcyNzYxNzU4&force=true&w=768'
base_image = Image.open(io.BytesIO(requests.get(url).content))
base_image.resize((256, 256))
Then, pre-process the example image so it can be passed to the model
image_uint8 = np.asarray(base_image)
image = image_uint8.astype(np.float32) / 255.0
input_shape = (config.dataset_configs.input_size, config.dataset_configs.input_size, 3)
input_image = jax.image.resize(image, input_shape, "cubic", antialias=True)
text_queries = ['car', 'truck', 'person', 'red car', 'green car', 'car parked straight']
tokenized_queries = np.array([
    module.tokenize(q, config.dataset_configs.max_query_length)
    for q in text_queries
])

# Pad tokenized queries to avoid recompilation if number of queries changes:
tokenized_queries = np.pad(
    tokenized_queries,
    pad_width=((0, 100 - len(text_queries)), (0, 0)),
    constant_values=0)
Make a batch from the image/text inputs and run predictions
predictions = module.apply(
    variables,
    input_image[None, ...],
    tokenized_queries[None, ...],
    train=False)
Remove the batch dimension from the output and convert it to numpy
predictions = jax.tree_util.tree_map(lambda x: np.array(x[0]), predictions)
Inspect the shape of the predictions output. Most important keys are:
pred_boxescontains the coordinates of the detected boxespred_logitscontains the logits for predicted classes
predictions.keys()
Let's extract now the boxes and converts the logits to actual probabilities/scores and get the most likely labels
logits = predictions['pred_logits'][..., :len(text_queries)]  # Remove padding.
scores = sigmoid(np.max(logits, axis=-1))
labels = np.argmax(predictions['pred_logits'], axis=-1)
boxes = predictions['pred_boxes']
The following helper function will filter out predictions with score lower than a threshold and plot the boxes and labels of the remaining predictions.
def plot_predictions(labels, scores, boxes, score_threshold = 0.1, figsize=(8, 8)):
    fig, ax = plt.subplots(1, 1, figsize=figsize)
    ax.imshow(input_image, extent=(0, 1, 1, 0))
    ax.set_axis_off()

    for score, box, label in zip(scores, boxes, labels):
        if score < score_threshold:
            continue
        cx, cy, w, h = box
        ax.plot(
            [cx - w / 2, cx + w / 2, cx + w / 2, cx - w / 2, cx - w / 2],
            [cy - h / 2, cy - h / 2, cy + h / 2, cy + h / 2, cy - h / 2], 'r')
        ax.text(
            cx - w / 2,
            cy + h / 2 + 0.015,
            f'{text_queries[label]}: {score:1.2f}',
            ha='left',
            va='top',
            color='red',
            bbox={
                'facecolor': 'white',
                'edgecolor': 'red',
                'boxstyle': 'square,pad=.3'
            })
Let's first plot predictions with a score higher than 0.1
plot_predictions(labels, scores, boxes)
Notice how the model was able to accurately find an object matching the descriptions red car and green car. But in the same time failed to detect all of the instances, we can address this by reducing the filtering threshold.
If we decrease the threshold then more predictions will be ploted, which in some cases leads to overlapping boxes.
plot_predictions(labels, scores, boxes, 0.05)
Notice the overlapping boxes on the truck as the model failed to classify it properly.
That's all folks
OWL ViT is a powerful object detection model that can be used to detect objects based on their descriptions. In this article, we saw how to use the original Flax-based implementation to perform this.
I hope you enjoyed this article, feel free to leave a comment or reach out on twitter @bachiirc.